








(NAIROBI, KENYA) – Equity Bank has the largest branch network and the most insured deposits among Kenyan banks, according to the Central Bank of Kenya’s Bank Supervision Annual Report 2025.
Equity Bank Kenya closed the year with 13.87 million deposit accounts.
That is the second largest account base in the sector, behind NCBA’s 36.31 million and ahead of KCB’s 12.38 million. Equity’s account count fell by 534,202 from 2024.
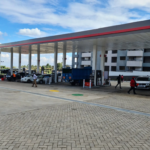
Equity now operates 216 branches, against 211 for KCB. No other bank has more than 184. Equity also holds the largest volume of insured deposits, at KES 179.7 billion ($1.39 billion / GBP 1.04 billion), ahead of KCB’s KES 157.7 billion ($1.22 billion / GBP 912 million).
Among Kenyan banks’ regional subsidiaries, Equity Group is the largest employer. Its subsidiaries had 5,245 staff at the end of 2025, up from 5,008 a year earlier, compared with 3,978 at KCB Group.
The Democratic Republic of Congo is Equity’s largest foreign market, with 2,199 employees. Uganda has 1,332 and Rwanda 1,010. The Central Bank of Kenya says the growth in subsidiary headcount across the sector was mainly driven by Equity’s operations in Uganda and the DRC.
Equity’s DRC unit, Banque Commerciale du Congo (BCDC), held KES 537.2 billion ($4.15 billion / GBP 3.11 billion) in deposits, or 29.3% of all deposits held by Kenyan banks’ subsidiaries abroad. It generated 36.5% of those subsidiaries’ profits.
In Kenya, Equity Bank’s return on equity of 32.3% was the highest among the large banks, ahead of Absa at 32.0% and KCB at 28.4%. These figures cover the Kenyan bank only and exclude the regional subsidiaries.
Equity reported KES 84.7 billion ($654 million / GBP 490 million) in gross non performing loans, down from KES 93.0 billion ($718 million / GBP 538 million) in 2024. KCB reported KES 192.8 billion ($1.49 billion / GBP 1.11 billion), up from KES 176.8 billion ($1.37 billion / GBP 1.02 billion). KCB’s loan book is more than twice the size of Equity’s, so the ratios are closer. Based on the Central Bank of Kenya’s loan and NPL figures, they were about 18.3% for Equity and 19.0% for KCB. Equity’s gross loans fell from KES 478.8 billion ($3.70 billion / GBP 2.77 billion) to KES 462.5 billion ($3.57 billion / GBP 2.68 billion) over the year.
Equity is a small player in residential mortgages. It holds 3.7% of the market, or KES 11.3 billion ($87.3 million / GBP 65.4 million), down from 4.4% in 2024. KCB leads with 33.2%. Absa and Stanbic follow with 10.9% each.
While Equity leads on branches, insured deposits and regional jobs, the Central Bank of Kenya data shows it trails KCB on most measures of size and profit.
By balance sheet, Equity remains second. KCB Bank Kenya leads with KES 1.50 trillion ($11.6 billion / GBP 8.7 billion) in total net assets, against Equity’s KES 1.04 trillion ($8.03 billion / GBP 6.02 billion).
The same order holds for deposits and lending. KCB holds KES 1.15 trillion ($8.89 billion / GBP 6.66 billion) in total deposits, compared with Equity’s KES 849.2 billion ($6.56 billion / GBP 4.91 billion). KCB’s gross loans of KES 1.01 trillion ($7.81 billion / GBP 5.85 billion) are more than double Equity’s KES 462.5 billion ($3.57 billion / GBP 2.68 billion).
KCB also posted the highest pre tax profit, at KES 63.69 billion ($492 million / GBP 369 million). Equity was second at KES 44.03 billion ($340 million / GBP 255 million).
Although Equity has the largest regional workforce, it ranks second for branches outside Kenya. KCB operates 239 cross border branches to Equity’s 186.
On core capital, KCB leads with KES 183.0 billion ($1.41 billion / GBP 1.06 billion), followed by Co operative Bank at KES 126.2 billion ($975 million / GBP 730 million). Equity ranked third with KES 122.2 billion ($944 million / GBP 707 million).